


- ETH’s short-term outlook shows signs of a bullish reversal around the psychological $3,000 level.
- On-chain metrics indicate selling pressure, but most ETH holders continue to make profits.
Ethereum [ETH] was also hit by the recent altcoin correction, falling over 20% after being rejected at the $4,000 resistance level.
However, this downtrend may not be significant as Ethereum’s technical patterns and on-chain metrics show mixed signals of a potential price recovery or further volatility.
ETH is approaching key support at $2.8k
On the weekly chart, Ethereum’s price movement shows consolidation into a bullish flag pattern – a pattern that often precedes a breakout. The recent dip has brought ETH close to the lower limit of this rising flag, at $2,800.
If this level holds, it could act as a springboard for a massive upward rally. A successful recovery here could push Ethereum towards its next major target of $6,000.
However, if this support is not maintained, ETH could be exposed to even more downsides.
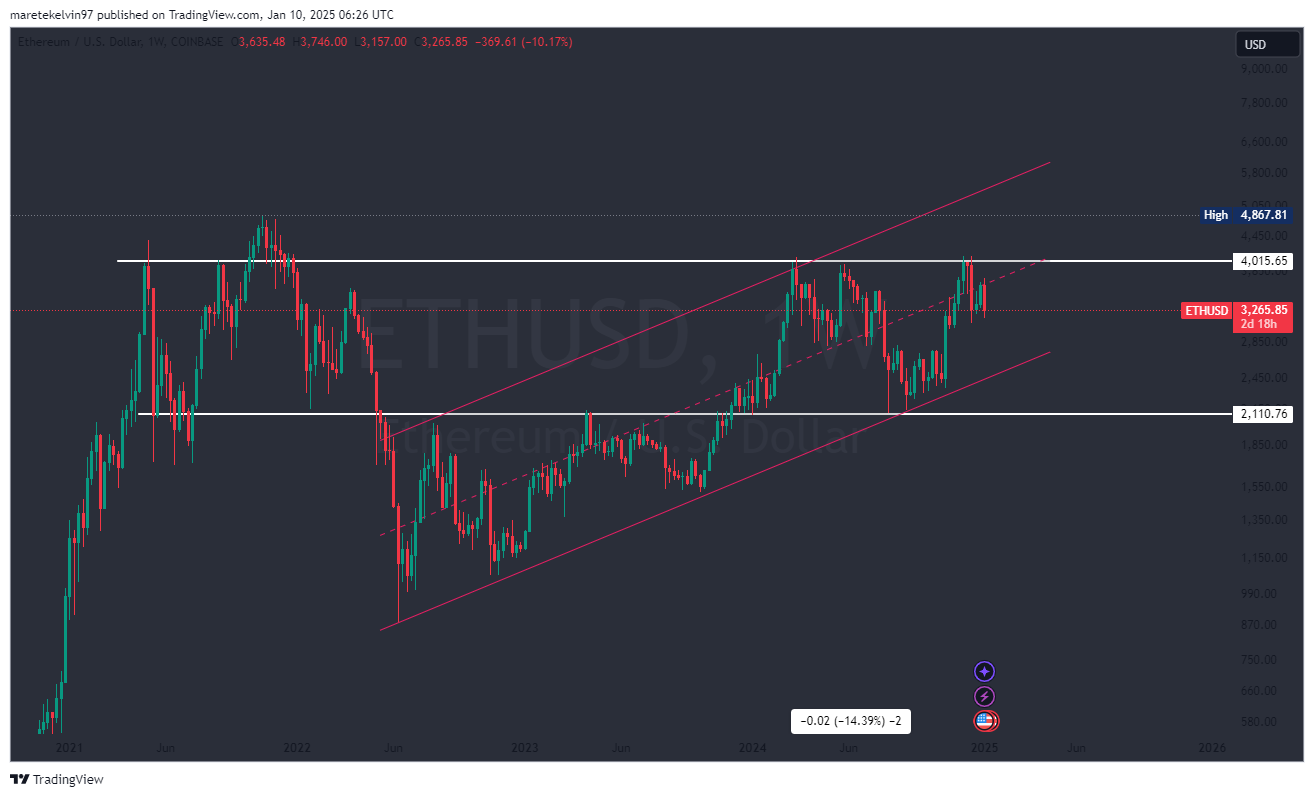
Source: TradingView
Signs of a near-term reversal at $3,000
Zooming into the daily chart, Ethereum’s price action indicates a potential bullish reversal in the short term.
The psychological level of $3,000 seems crucial as ETH trading activity has increased slightly over the past 24 hours.
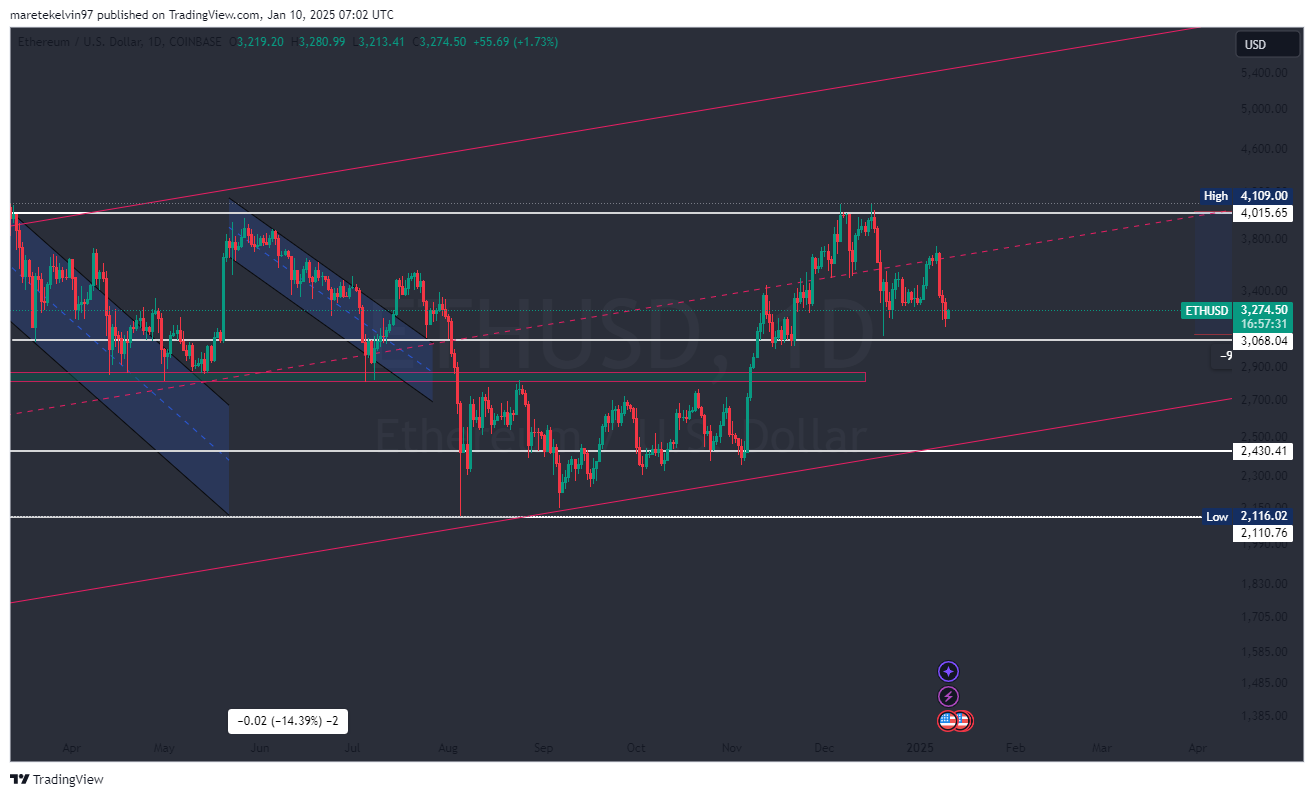
Source: TradingVew
CryptoQuant data supports this, showing a sharp increase in the number of active addresses over the same period. Increased network activity often signals renewed interest, potentially stabilizing prices or creating upward movement.
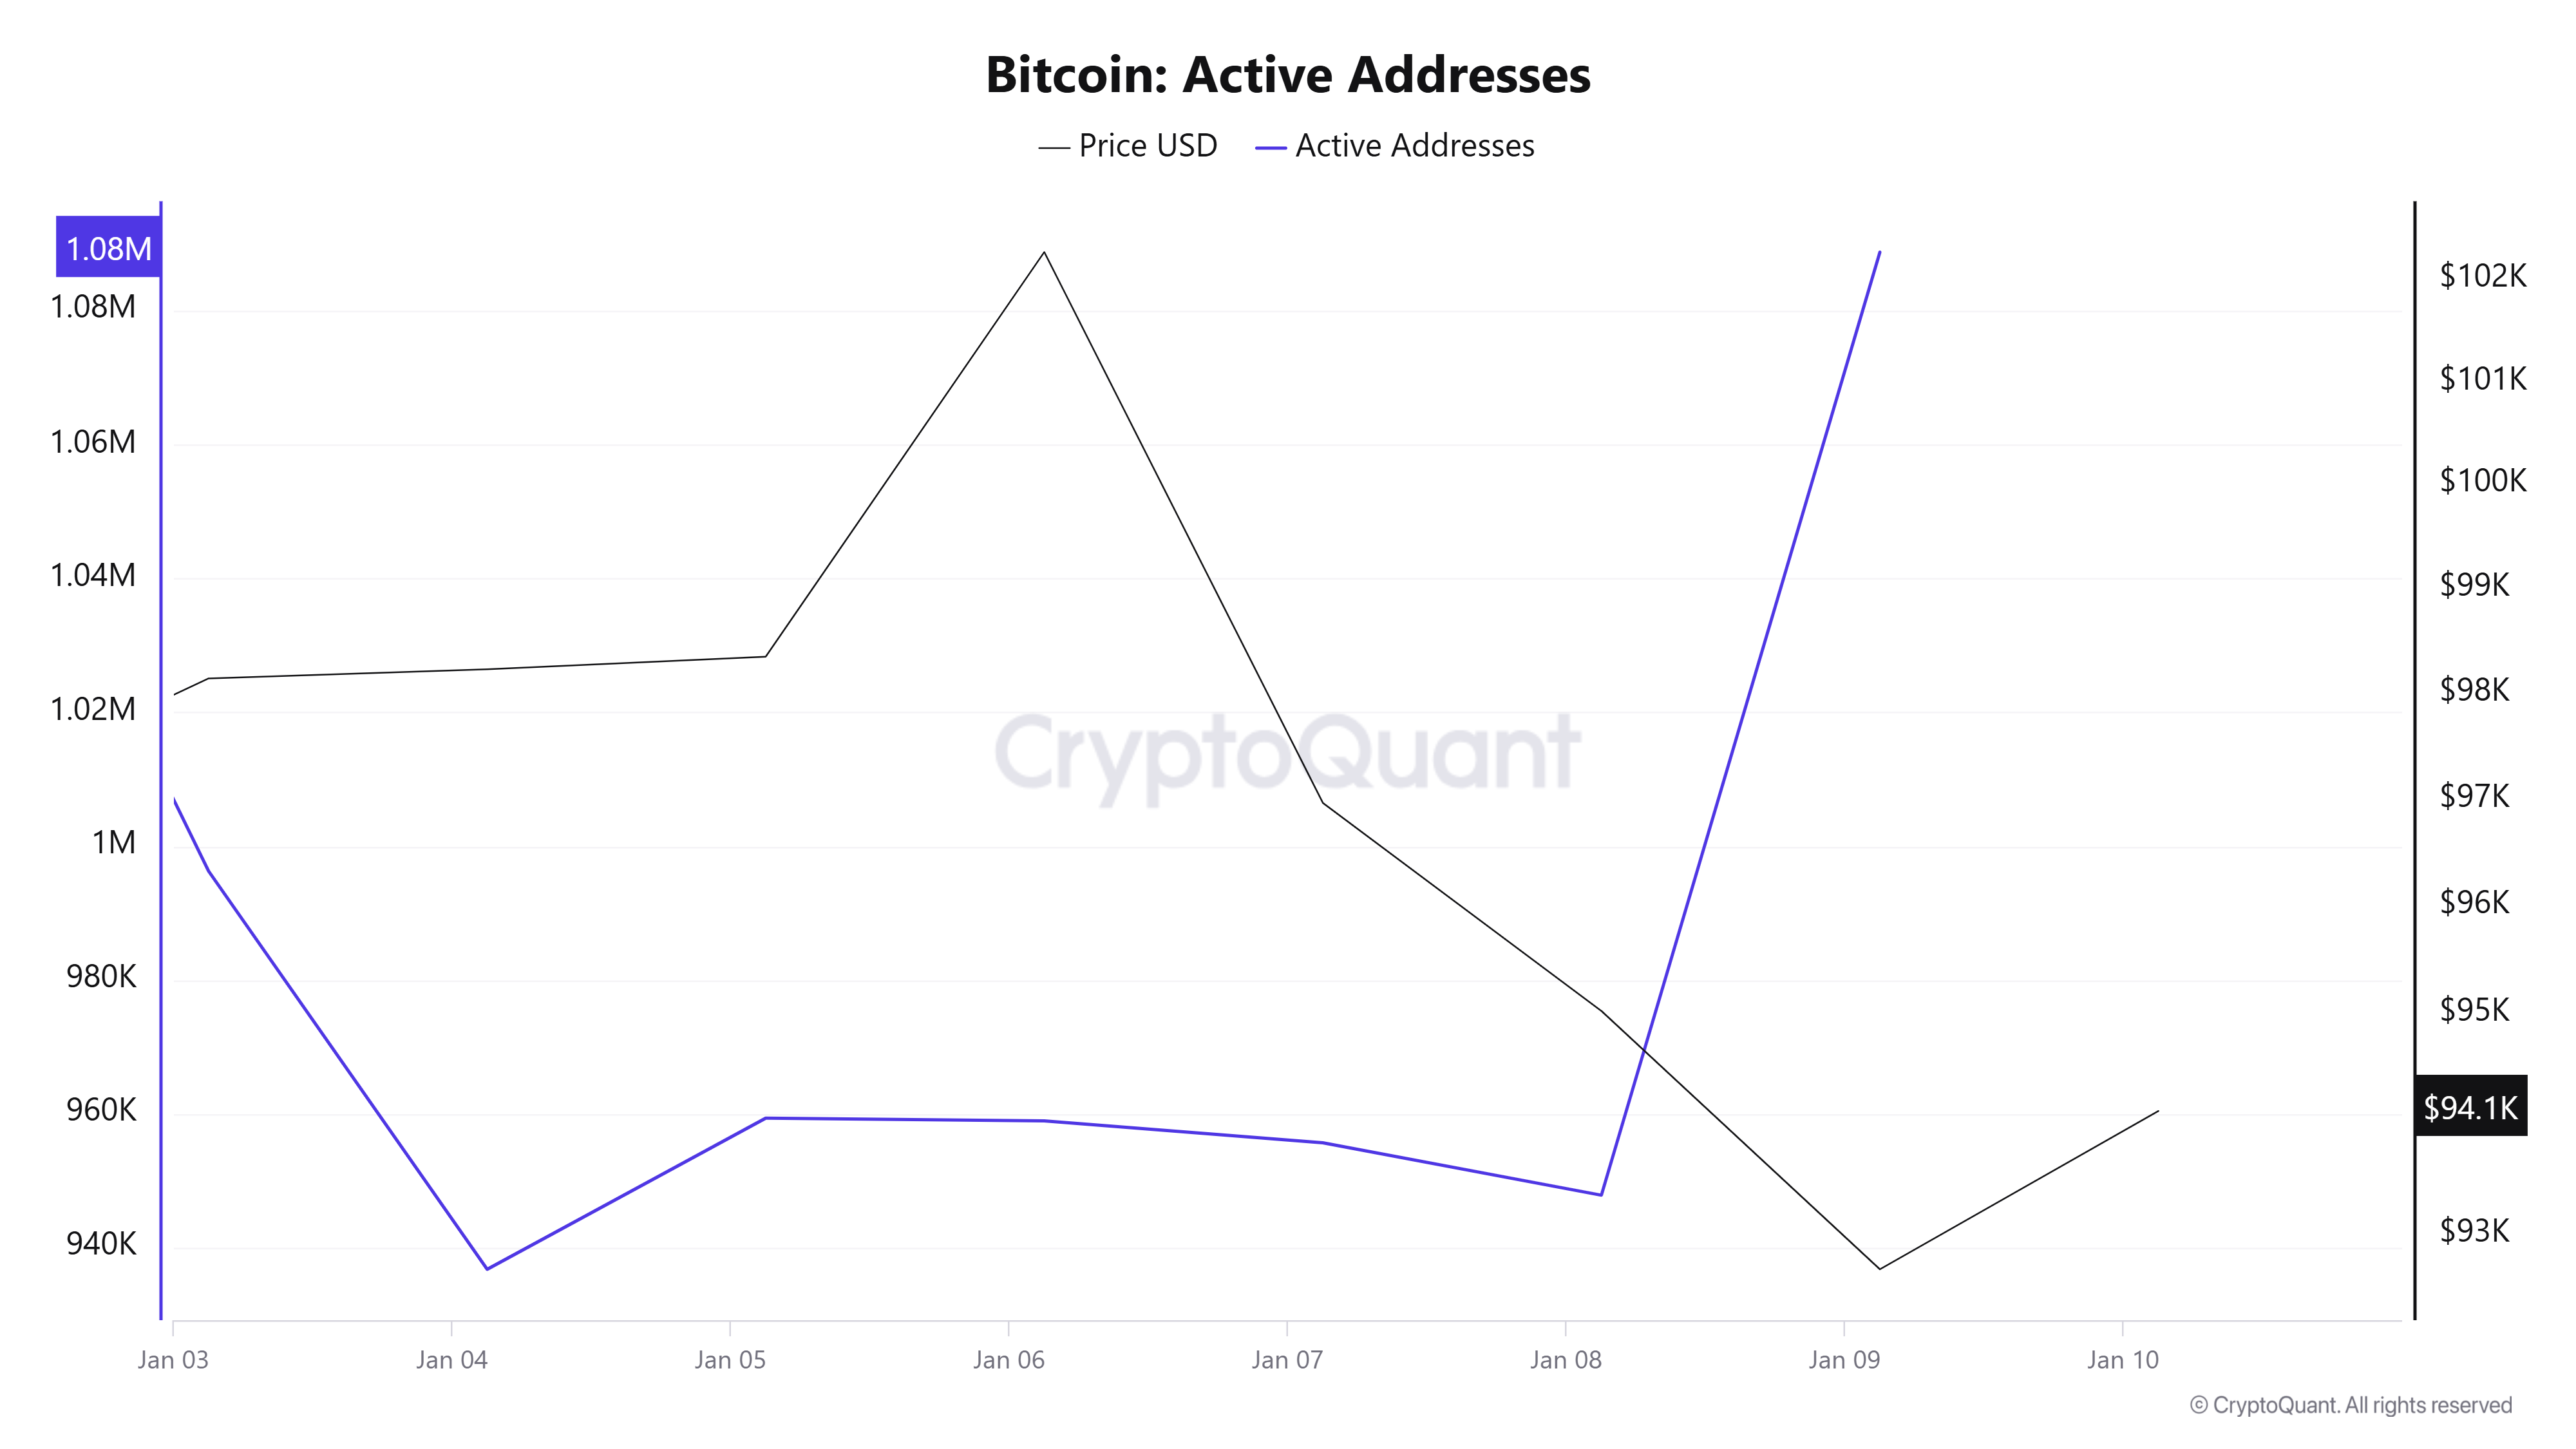
Source: CryptoQuant
Rising currency outflows indicate profit-taking
While the short-term signals are relatively bullish, the long-term on-chain metrics tell a different story.
According to CryptoQuant, ETH outflows have surged over the past 24 hours, indicating increasing selling pressure as investors book profits around the psychological $3K level.
Historically, these outflow cycles alternate between peaks and troughs, and the current upswing could represent an accumulation of sell-side activity.
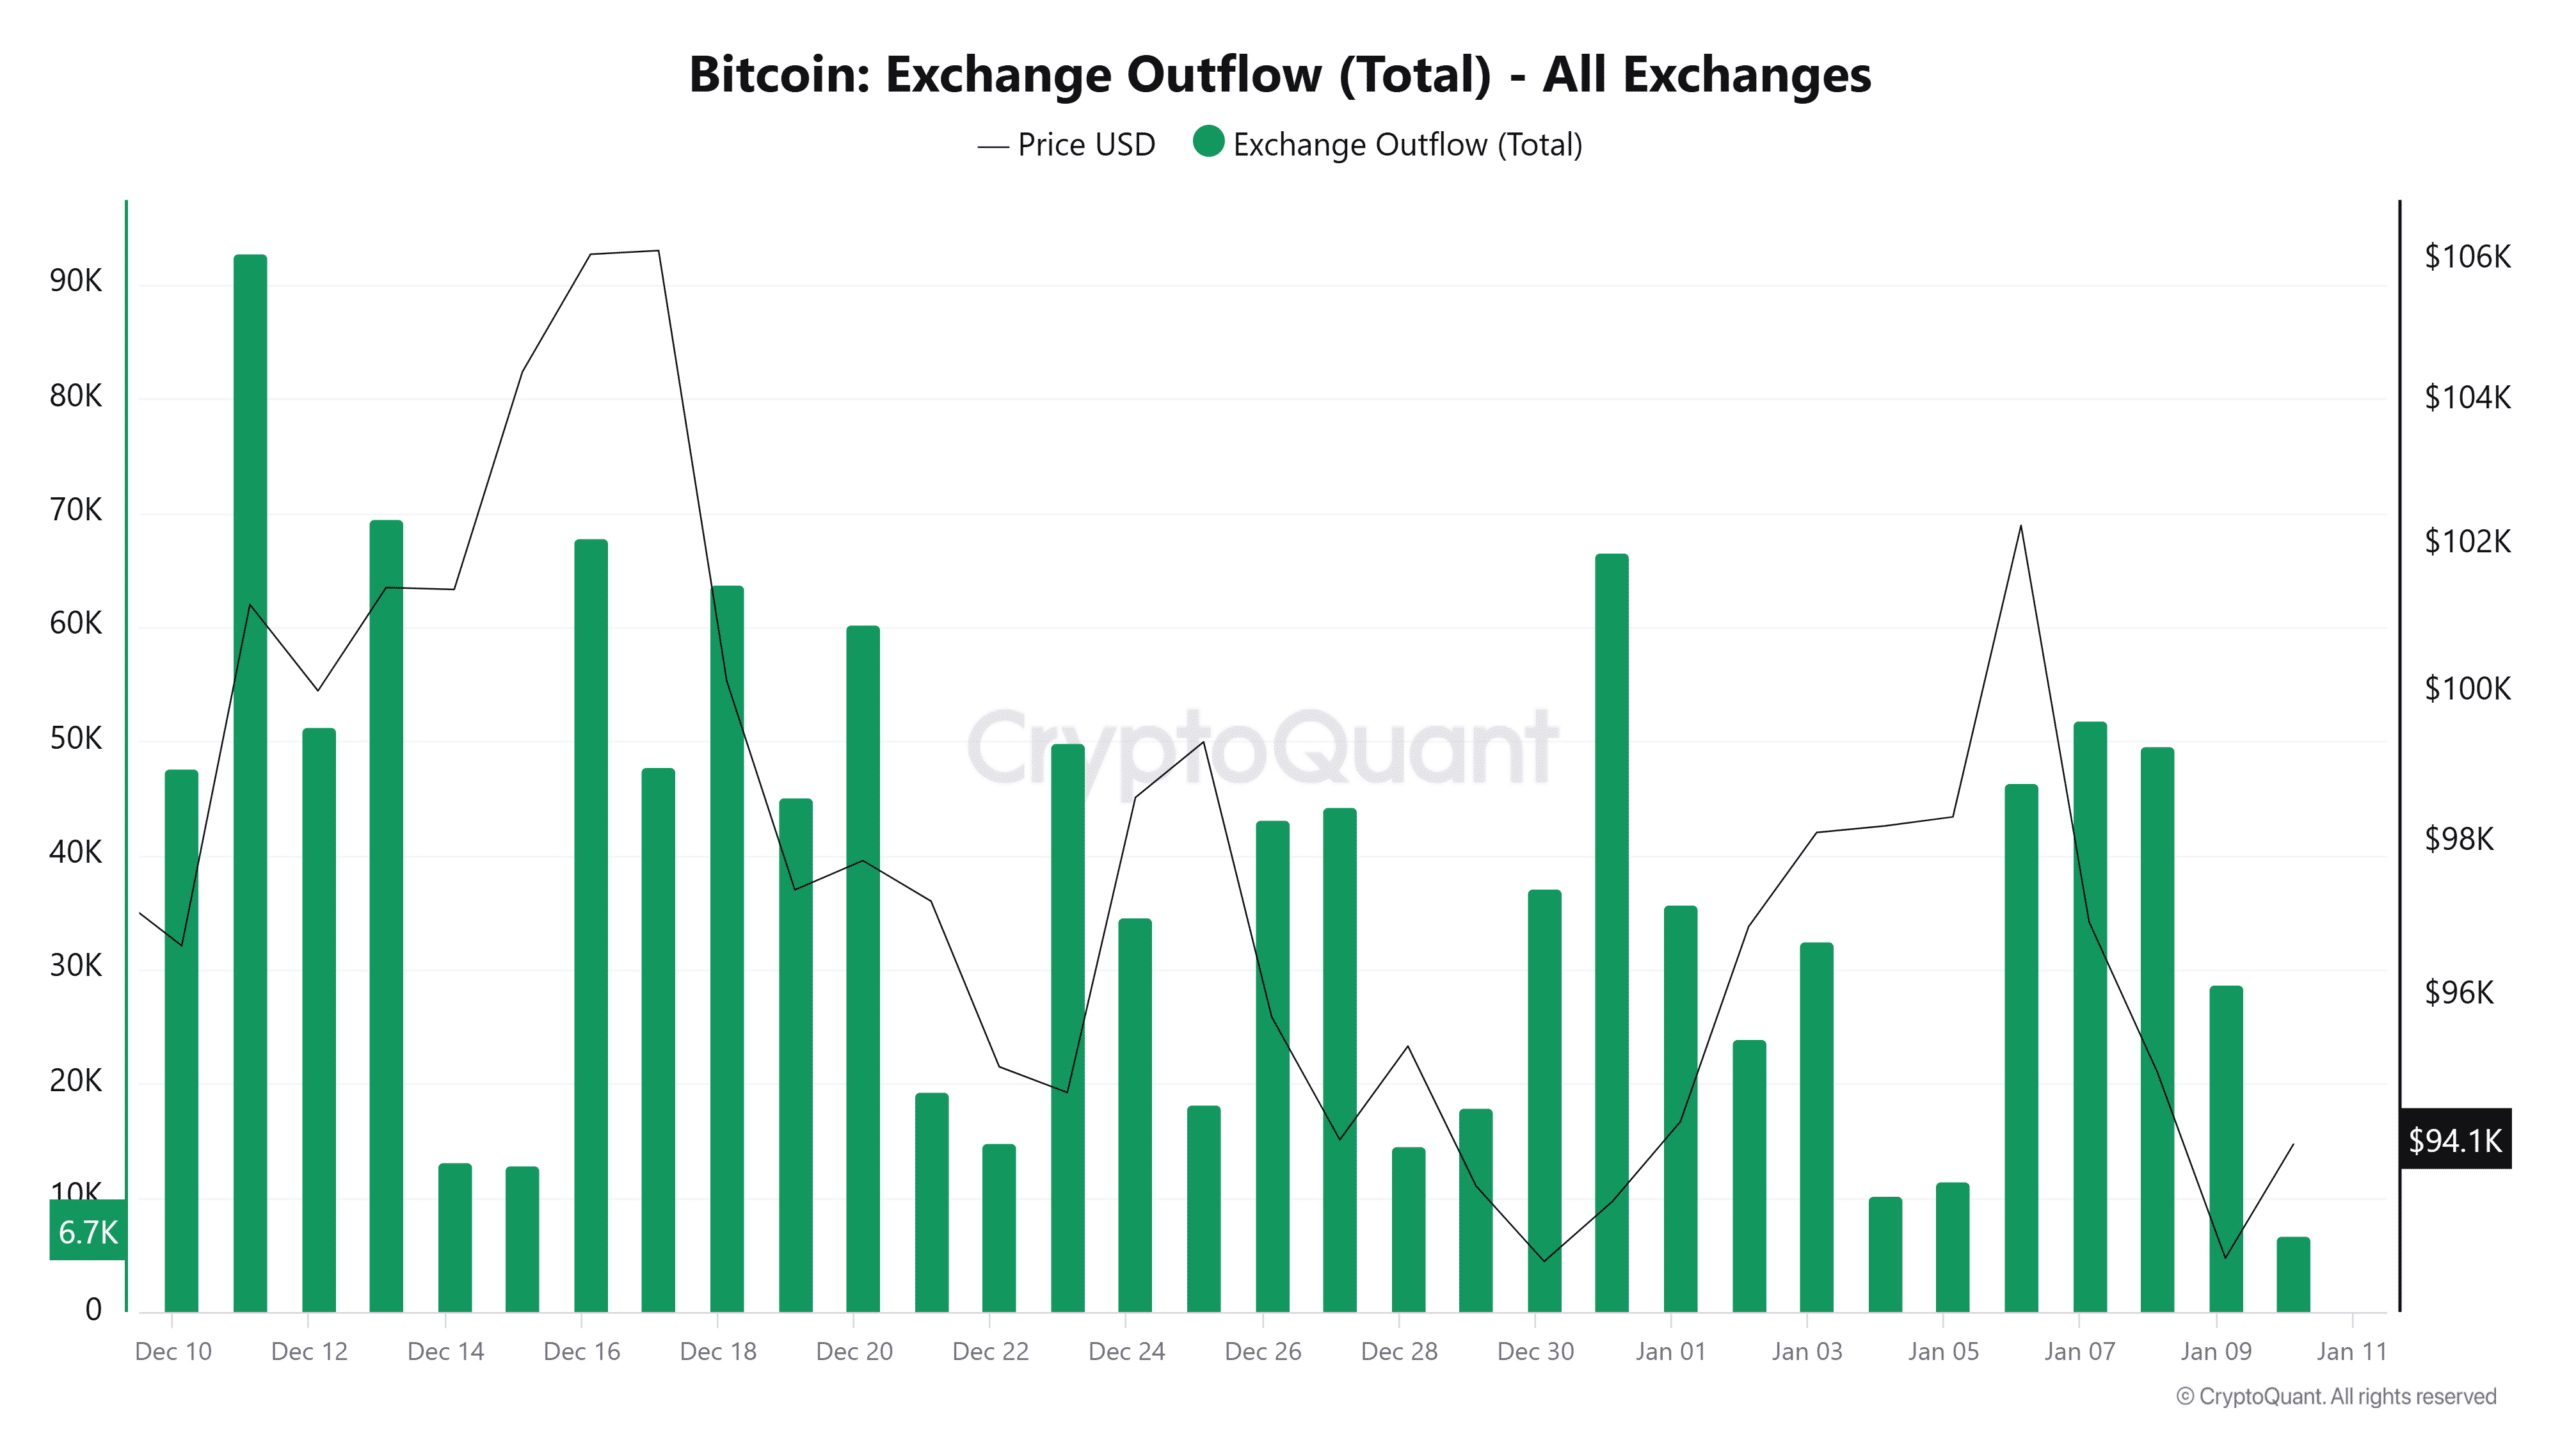
Source: CryptoQuant
ETH Holders Remain Profitable Despite…
Despite short-term corrections, most ETH holders continue to make profits. Data from IntoTheBlock shows that 76% of all addresses holding ETH are profitable at current price levels. This reflects confidence among long-term investors and indicates a strong foundation for Ethereum’s potential continued rally.
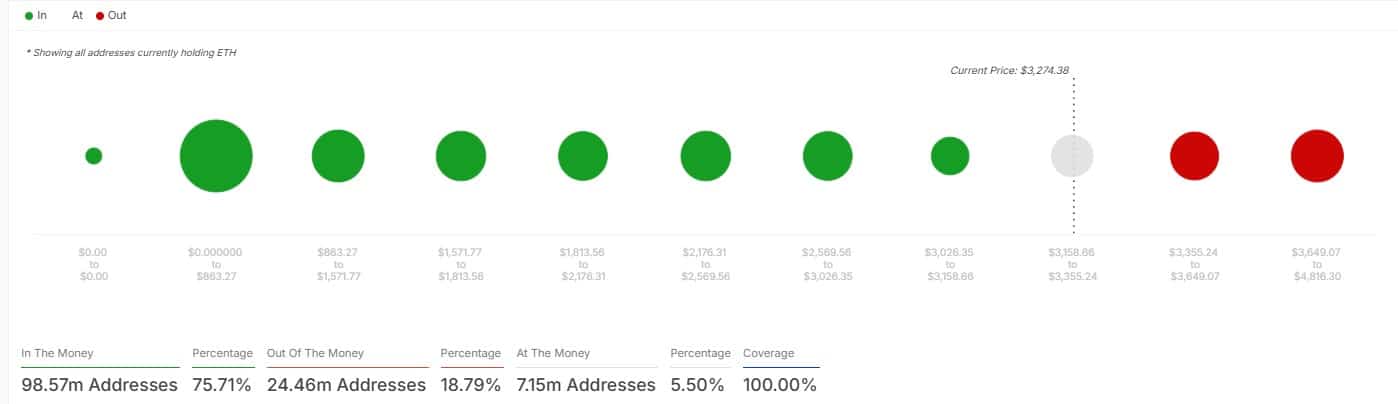
Source: IntoTheBlock
Read Ethereum’s [ETH] Price forecast 2025–2026
Ethereum’s short-term and long-term price action depends on a number of key levels. The $2.8K support level could pave the way for a significant rally if it holds, while increased network activity around the $3K psychological level supports a bullish outlook.
With most holders still making profits, ETH’s long-term trajectory remains optimistic.
Credit : ambcrypto.com
