


XRP price moves higher above the $0.5400 zone. The price needs to break above the resistance at USD 0.5550 to set the pace for a bigger increase.
- XRP price is attempting a fresh rise above the $0.540 zone.
- The price is now trading above USD 0.5410 and the 100-hourly Simple Moving Average.
- A major bullish trendline is forming with support at $0.5395 on the hourly chart of the XRP/USD pair (Kraken data source).
- The pair could gain bullish momentum if it overcomes the USD 0.550 and USD 0.5550 resistance levels.
XRP price revisits resistance
XRP price started a downside correction from the USD 0.5550 resistance zone. There was a move below the support at $0.5420. However, the bulls were active at $0.5320. A low was formed at $0.5317 and the price is now rising along with Bitcoin and Ethereum.
The price climbed above the USD 0.5380 and USD 0.540 resistance levels. There was a move above the 50% Fib retracement level of the downward move from the $0.5550 swing high to the $0.5317 low.
The price is now trading above USD 0.540 and the 100-hourly Simple Moving Average. A major bullish trendline is also forming with support at $0.5395 on the hourly chart of the XRP/USD pair.
On the upside, the price could face resistance near the $0.5460 level or the 61.8% Fib retracement level of the downward move from the $0.5550 swing high to the $0.5317 low. The first major resistance is around the $0.5500 level. The next major resistance could be at USD 0.5550.
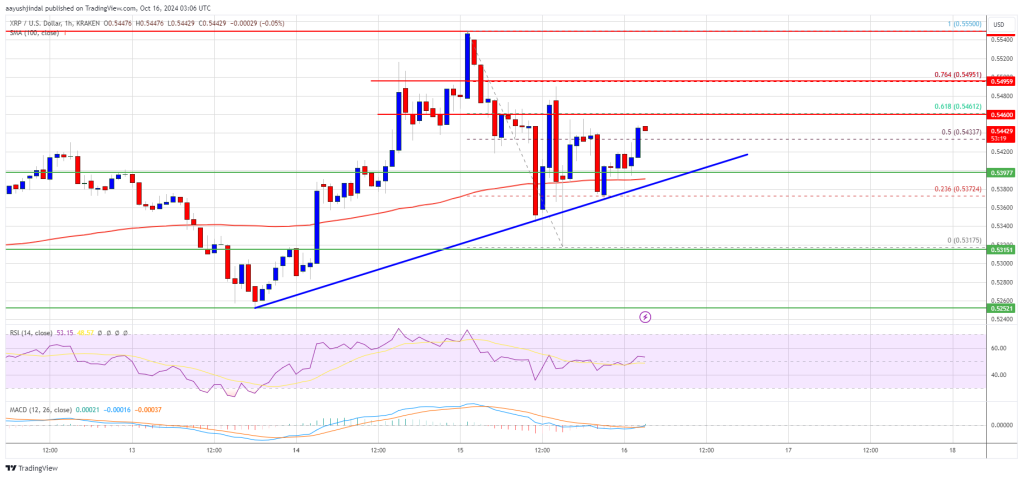
A clear move above the USD 0.5550 resistance could send the price towards the USD 0.5650 resistance. Any further gains could send the price towards the near-term resistance at $0.5800 or even $0.5880. The next big hurdle could be $0.6000.
Another drop?
If XRP fails to break the USD 0.550 resistance zone, it could trigger a fresh decline. The initial downside support is near the $0.540 level and the trendline. The next major support is near the $0.5320 level.
If there is a downside break and a close below the USD 0.5320 level, the price could continue falling towards USD 0.5210 in the near term. The next major support is near the $0.5050 zone.
Technical indicators
Hourly MACD – The MACD for XRP/USD is now gaining speed in the bullish zone.
Hourly RSI (Relative Strength Index) – The RSI for XRP/USD is now above the 50 level.
Major support levels – $0.5400 and $0.5320.
Major resistance levels – $0.5500 and $0.5550.
Credit : www.newsbtc.com
